Fiber digestion at 12 hours in the rumen
October 28, 2020 Insights – Fiber digestibility has been used for quite some time to help evaluate quality and milk potential from a given forage. Initially, our industry started with a 48-hour in vitro rumen digestion estimate. This time point approximated forage rumen retention time for a ruminant at maintenance intake level (i.e. a dry cow). With today’s high producing cows consuming over 60 pounds of dry matter per day, we recognize that forage may only be within the rumen for 24 hours. Hence, we use multiple time points in our dairy ration models to help imitate fiber digestion and better predict cow performance. Looking at the 30, 120 and 240-hour Neutral Detergent Fiber Digestibility (NDFD) values has helped predict performance, and rank forages in terms of quality.
As we continue to learn, progress and the importance of multiple observations over time in the rumen (to characterize fiber), we are now looking at shorter time points to help improve predicted forage performance potential. Recently, we have added a 12-hour NDFD to our Comprehensive Nutrition Analysis for all forage types. This could be a valuable next step to better predict animal performance from forage and to rank forages based on fiber digestibility.
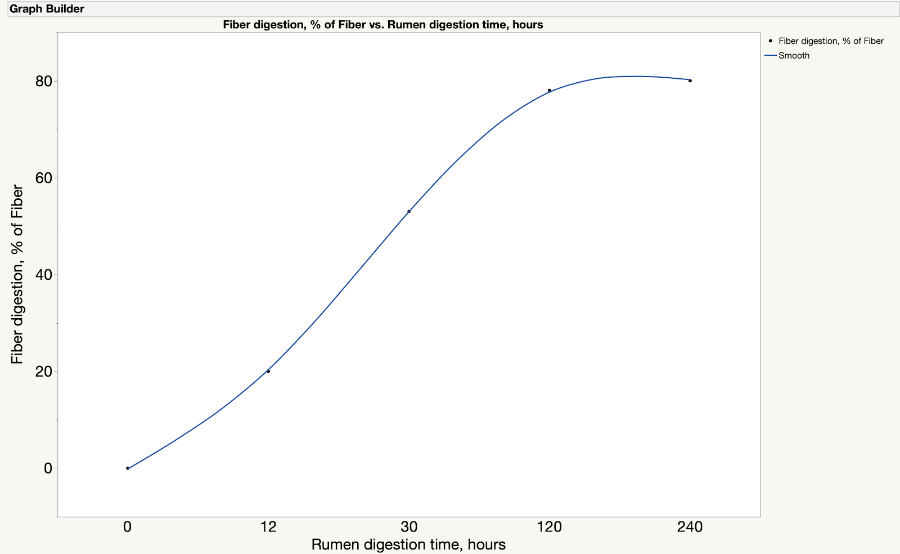
The 12-hour time point adds rumen fiber digestion to our multi-time point assessment to help characterize a forage. With this information, we can anchor the fiber digestion curve and differentiate slow versus fast-digesting fiber. This is visible in Figure 1. Note how the 12-hour NDFD observation adds to the curvature of the trendline, which may help us understand the fast-digesting fiber degradation rate.
Overall, increased rumen fiber digestion speed, as well as extent, can contribute to a more stable rumen environment and means more energy to the cow via increased acetate and butyrate production. This additional energy can be used for increased production, improved components, or body condition.

Figure 1: An average fiber digestion curve for corn silage at Rock River Laboratory, Inc.
Milk fat depression? Feed trends of interest
July 22, 2020 Insights – With the summer heat comes inevitable nutrition technical support and troubleshooting questions centering on alleviating milk fat depression. This year proves no different, with some herds suffering from unexplainable dips in milk fat production. Professor Kevin Harvatine and colleagues have recently documented seasonal rhythms to milk protein and fat production and shown that milk protein and fat trend down through the summer months. Leaning on previous learning from Professor Adam Lock and my own past experience, I’ve found meaningful trends relating starch fermentability and the fatty acid profile to consider in these milk fat depression troubleshooting cases:
Corn silage, grain starch digestibility, and Total Mixed Ration (TMR) implications
In many cases, Professor Lock stresses focusing on starch digestibility and diet fermentability rather than fine-tuning other diet aspects. Reason being, starch is often balanced to maintain optimal milk production. However, slight increases in starch digestibility with ongoing corn silage or grain ensiling can tip the rumen and slow down fatty acid biohydrogenation.
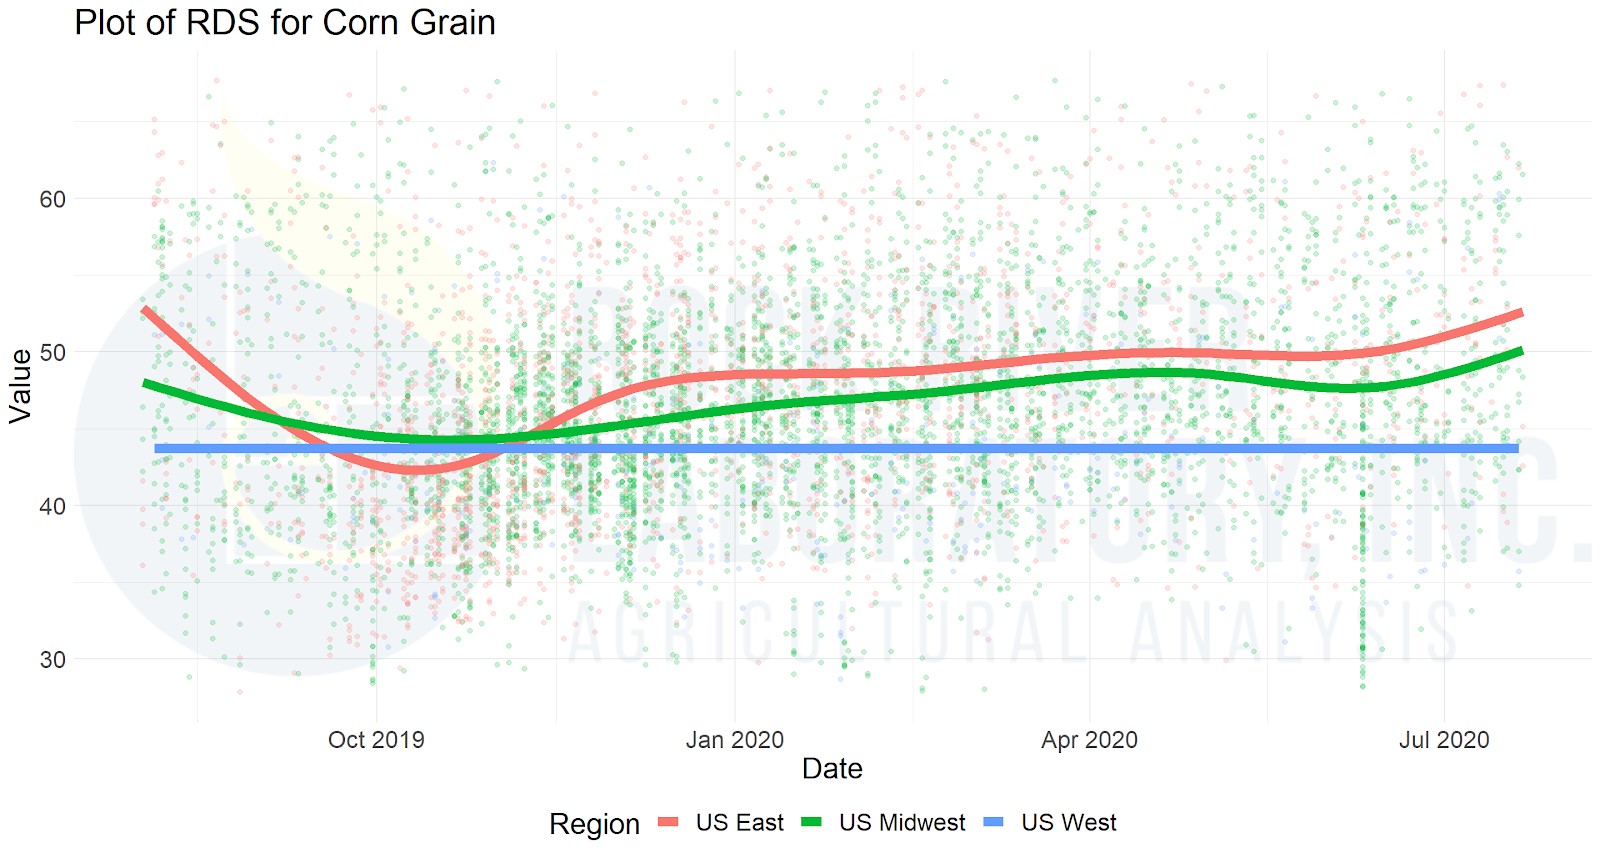
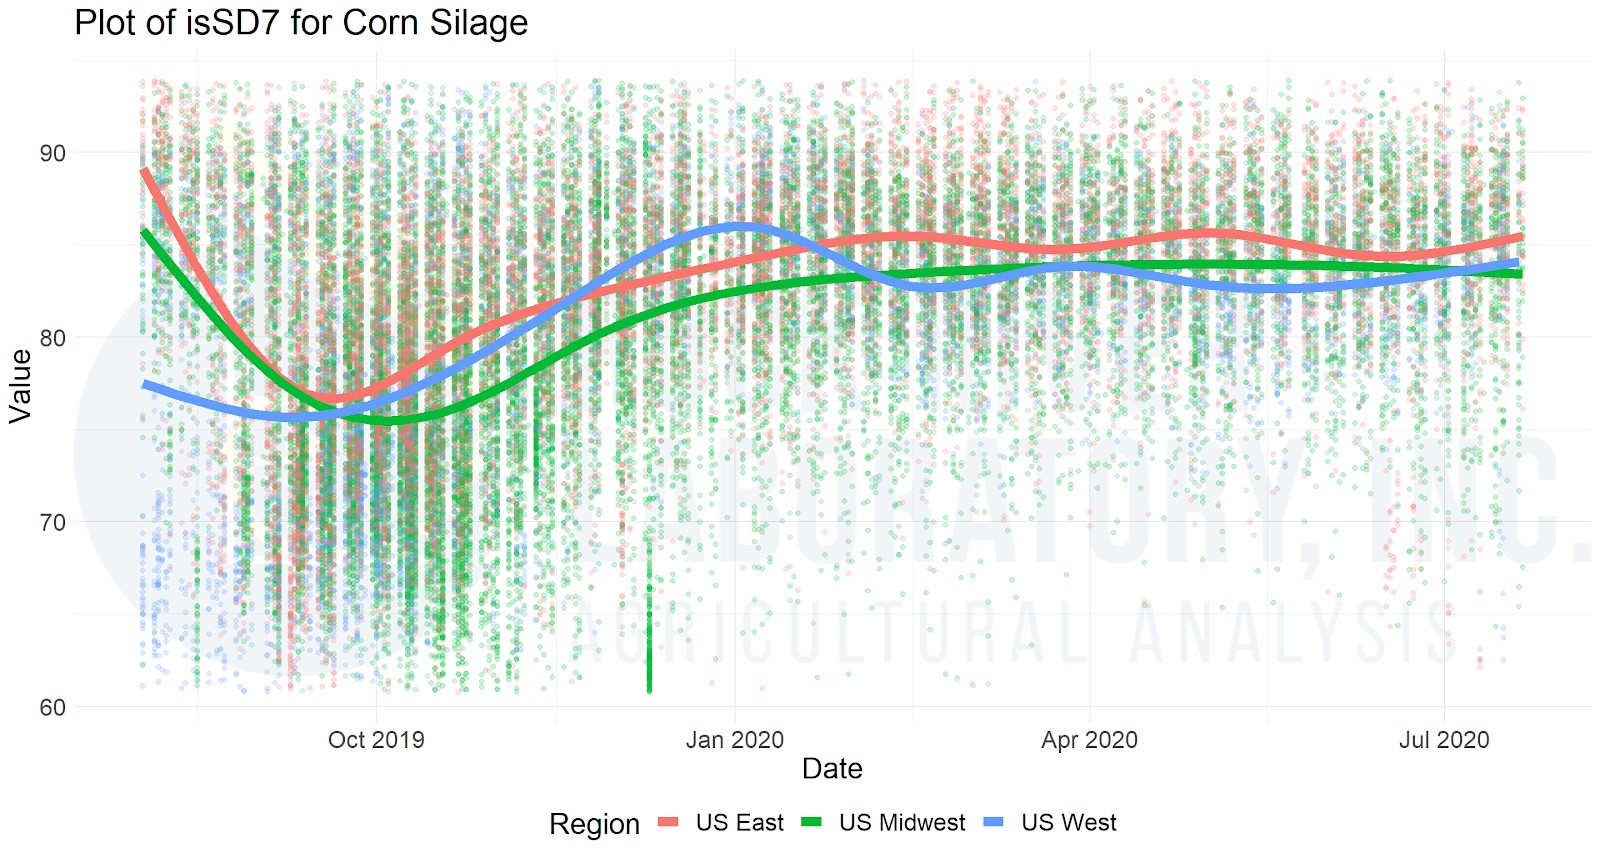
Figures 1 and 2 detail corn silage rumen starch digestibility (7-hour in situ rumen starch digestion, isSD7, percent of starch) and corn grain rumen degradable starch load (starch content x 7h isSD). In both figures, recognize that starch availability and impact in the rumen has increased, and will likely continue to do so. While these individual feed analyses can prove valuable, it is often more sensible to start with a TMR sample and assess diet starch digestibility as well as diet fatty acid profile and load.
Corn silage fatty acid profile
Corn silage doesn’t only contribute fermentable starch, but it can also contribute substantial fatty acid load to the diet at higher feeding rates. C18:2 and C18:3 fatty acids contribute to total poly-unsaturated fatty acid (PUFA) load in diets, which in a TMR is recognized to interact with other nutrition factors, such as diet starch fermentability. In cases where rumen fatty acid biohydrogenation slows down (due to rumen fermentable starch among other potential factors), the PUFA level may overwhelm the rumen microorganisms’ ability to biohydrogenate these fatty acids. In such cases, the detrimental t10,c12-C18:2 fatty acid, that can decimate milk fat production, may arise.
In troubleshooting diet PUFA load, some are looking closely at corn silage levels. To better understand potential relationships, we consulted with Professor Lock. He pointed out that Linolenic acid (C18:3) may have a great association with fiber than grain, as chlorophyll is richer in this poly-unsaturated fatty acid.
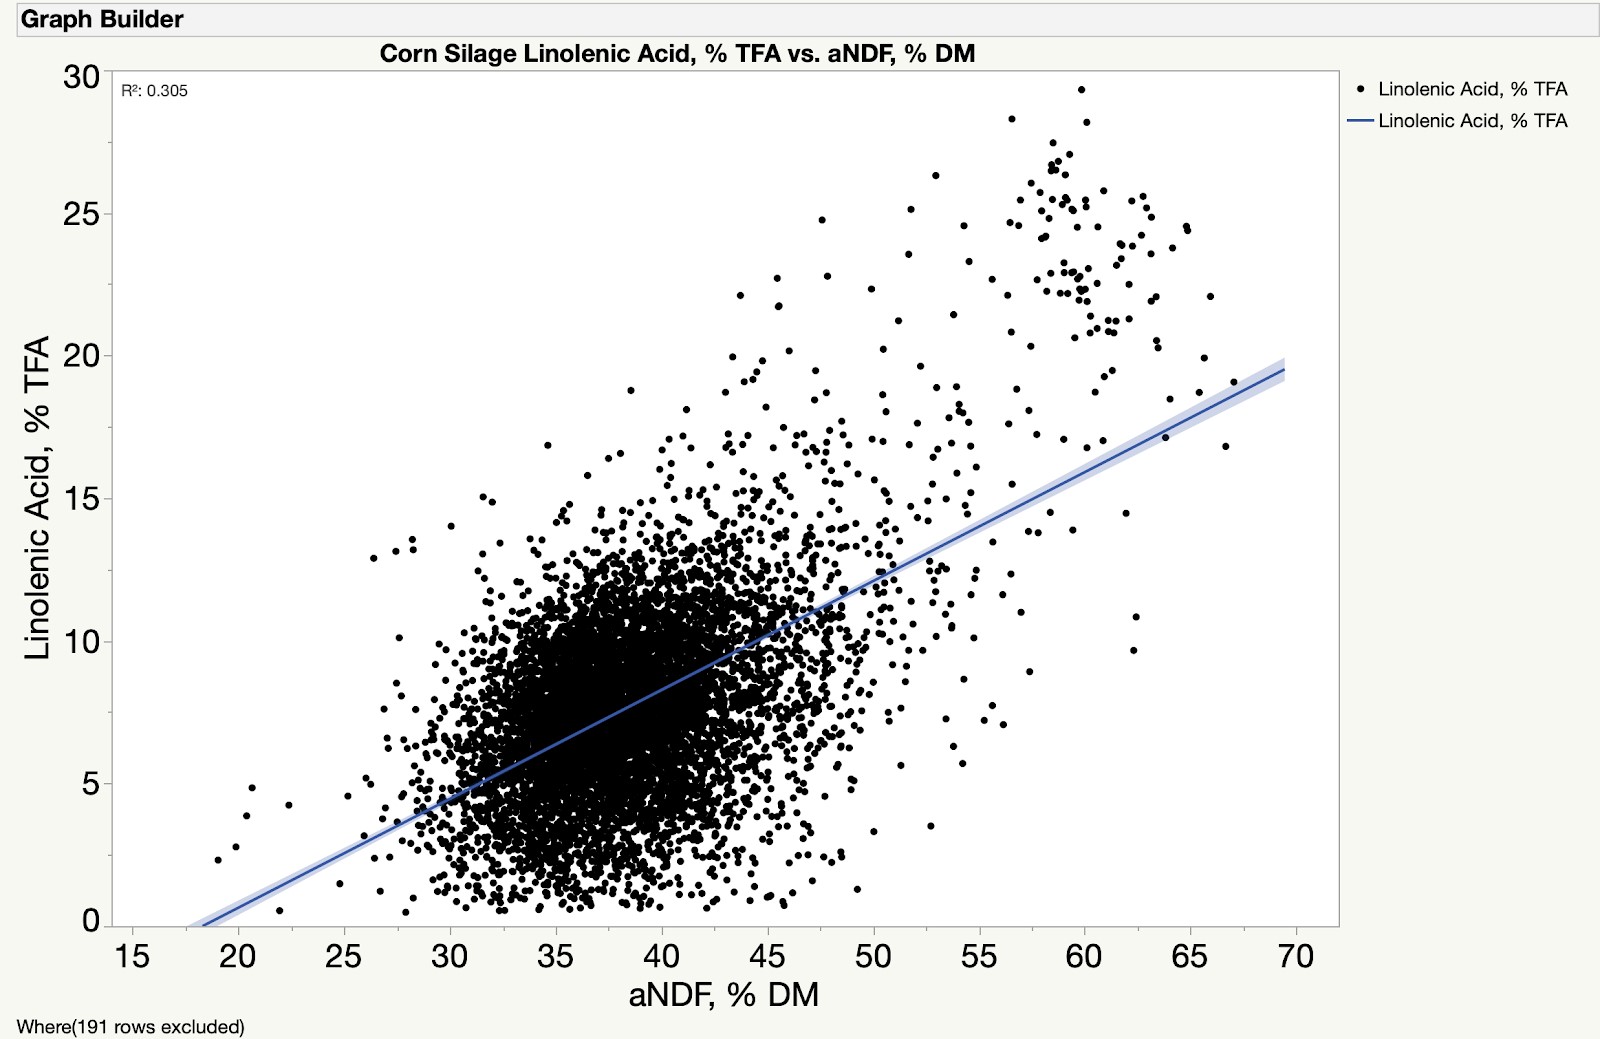
Interestingly, follow-up plots comparing corn silage fiber content to Linolenic acid showed an apparent relationship between the fiber and C18:3 – in agreement with Professor Lock’s theory on corn silage (Figure 3). If your silage is lower in starch content, it may also be carrying more C18:3 than higher starch silage, and this should be accounted for. The corn silage fatty acid profile can now be assessed as part of routine NIR forage analyses.
Figure 1: Corn silage rumen starch digestibility (7-hour, percent of starch) for samples submitted to Rock River Laboratory in the US since Aug 1, 2019.

Figure 2: Corn grain rumen digestible starch load (RDS = 7-hour starch digestibility x starch content; percent of DM) for samples submitted to Rock River Laboratory in the US since Aug 1, 2019.

Figure 3: Corn silage linolenic acid (percent total fatty acid) concentration versus fiber (aNDF, percent DM) for samples analyzed by Rock River Laboratory since January 1, 2020.
Find hidden commodity value when challenged with limited forage inventories
Dairy cow diet changes arise with the seasons in cases where Mother Nature has not been kind, and forage inventories are in low supply. There are two nutrition approaches to filling the gaps in diets when forage supply is limited: 1) change the corn silage to hay or haylage ratio, or 2) cut forage back and feed a highly digestible, fibrous byproduct feed.
Increasing the corn silage in the diet to maintain the forage feeding rate can work. However, this approach inevitably leads to cutting back on corn silage in the future, and thus another diet change. It also needs to be taken into account that corn silage brings highly digestible starch into the diet, and more corn silage will increase rumen fermentable starch load.
The second path – cutting back on forage and maintaining normal corn silage inventory – can contribute to more stability and consistency over the long haul. In this situation, forage and starch levels can be cut back, and highly digestible commodity feeds can be brought in to extend forage inventories. Soy hulls, corn gluten feed, wheat midds, corn distillers grains, and almond hulls (in the western US) are all viable alternative options, among several others, to balance diets and provide consistency. Just be sure to have an idea of the feed’s nutritional value and don’t assume a feed library ingredient measure is robust enough.
Professor Norm St-Pierre and Professor Bill Weiss have shown that aNDF in commodity feeds can vary as much as forages. This unrecognized variation could introduce inconsistency into the diet, however, if recognized and captured, then hidden nutritional value beyond what the broker may have listed on a spec sheet can be found.
Currently, feed analysis (by NIR) is applicable to commodity feeds in similar ways to forages and grains. Start with the table below to get an idea of what several commodities can provide in nutritional value when replacing forages. Then, dial in the diet by checking commodities for protein, fiber, and starch content, and find hidden value by recognizing the fiber digestibility potential. Update rations accordingly when exceptional fiber digestibility is uncovered and cut back on energy in the diet elsewhere.
|
Feed |
Parameter |
15th Percentile |
Median |
85th Percentile |
|
Almond Hulls |
aNDF |
23.6 |
30.3 |
52.1 |
|
Almond Hulls |
CP |
4.7 |
6.2 |
8.5 |
|
Almond Hulls |
NDFD30 |
N/A |
N/A |
N/A |
|
Corn Gluten Feed |
aNDF |
28.5 |
32.3 |
35.2 |
|
Corn Gluten Feed |
CP |
19.6 |
22.4 |
25.5 |
|
Corn Gluten Feed |
NDFD30 |
20.8 |
46.6 |
59.0 |
|
Corn Gluten Feed |
Starch |
10.6 |
14.8 |
19.0 |
|
Dry Distillers Grains |
aNDF |
30.0 |
34.5 |
38.6 |
|
Dry Distillers Grains |
CP |
23.8 |
30.1 |
37.0 |
|
Dry Distillers Grains |
NDFD30 |
5.5 |
33.3 |
50.9 |
|
Dry Distillers Grains |
Starch |
0.5 |
3.7 |
11.5 |
|
Soy Hulls |
aNDF |
56.0 |
59.1 |
63.3 |
|
Soy Hulls |
CP |
10.7 |
11.8 |
13.5 |
|
Soy Hulls |
NDFD30 |
61.8 |
70.1 |
73.1 |
|
Soy Hulls |
Starch |
0.3 |
1.3 |
3.3 |
|
Wet Distillers Grains |
aNDF |
29.4 |
34.3 |
38.1 |
|
Wet Distillers Grains |
CP |
21.9 |
23.9 |
33.0 |
|
Wet Distillers Grains |
NDFD30 |
5.5 |
24.4 |
36.3 |
|
Wet Distillers Grains |
Starch |
1.0 |
7.5 |
11.7 |
|
Wheat Midds |
aNDF |
26.7 |
30.8 |
36.3 |
|
Wheat Midds |
CP |
17.3 |
18.6 |
19.7 |
|
Wheat Midds |
NDFD30 |
11.5 |
20.4 |
31.6 |
|
Wheat Midds |
Starch |
21.0 |
26.9 |
33.0 |


